The Cloud Intelligence Graph™
The context your agents and engineers need.
Rapidly solve the most difficult cloud challenges you face today.
OpsCanvas maps your cloud in minutes, giving you and your team a live context graph so the AI you already use understands the topology, dependencies, ownership, costs, and blast radius, without needing tags.
Your model. Your AI tool. Your cloud. No new tools.
Live, Grounded Truth
The power of a live
Cloud Intelligence Graph™.
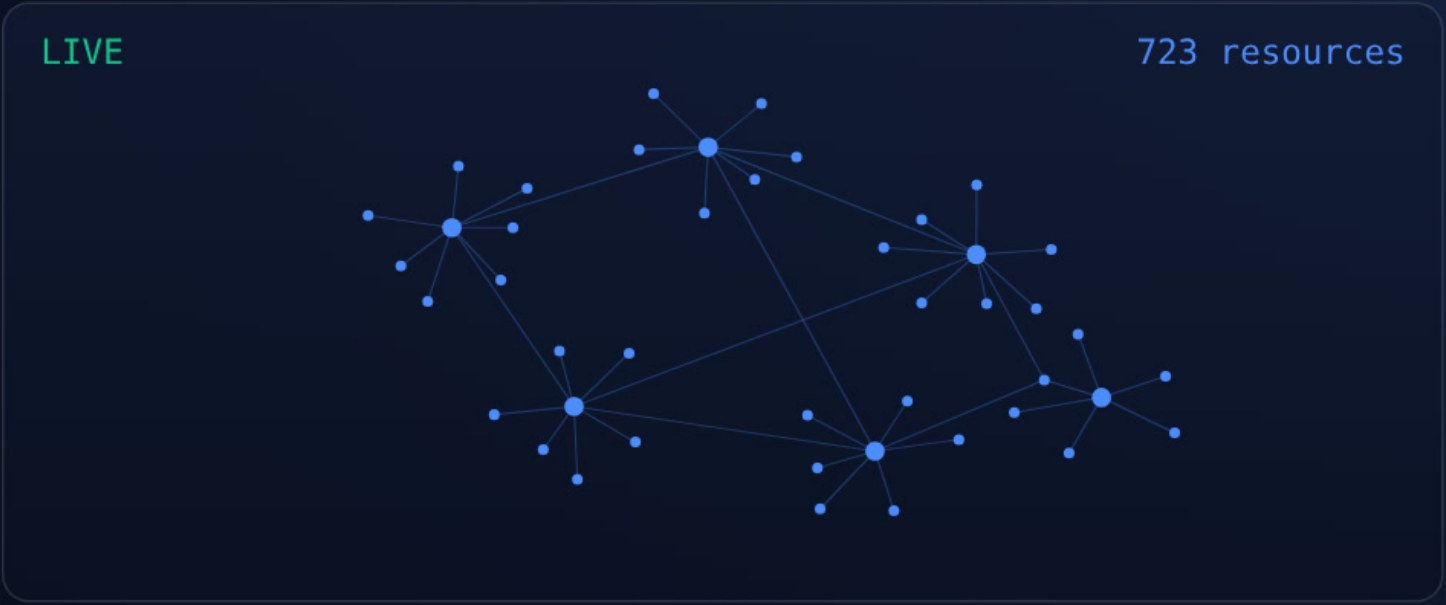
One live map of everything you run: applications, the networks that connect them, dependencies, owners, and costs, correlated in minutes and kept current as your cloud changes. Every answer your AI gives, and every action an agent proposes, is grounded in it.
The Problem
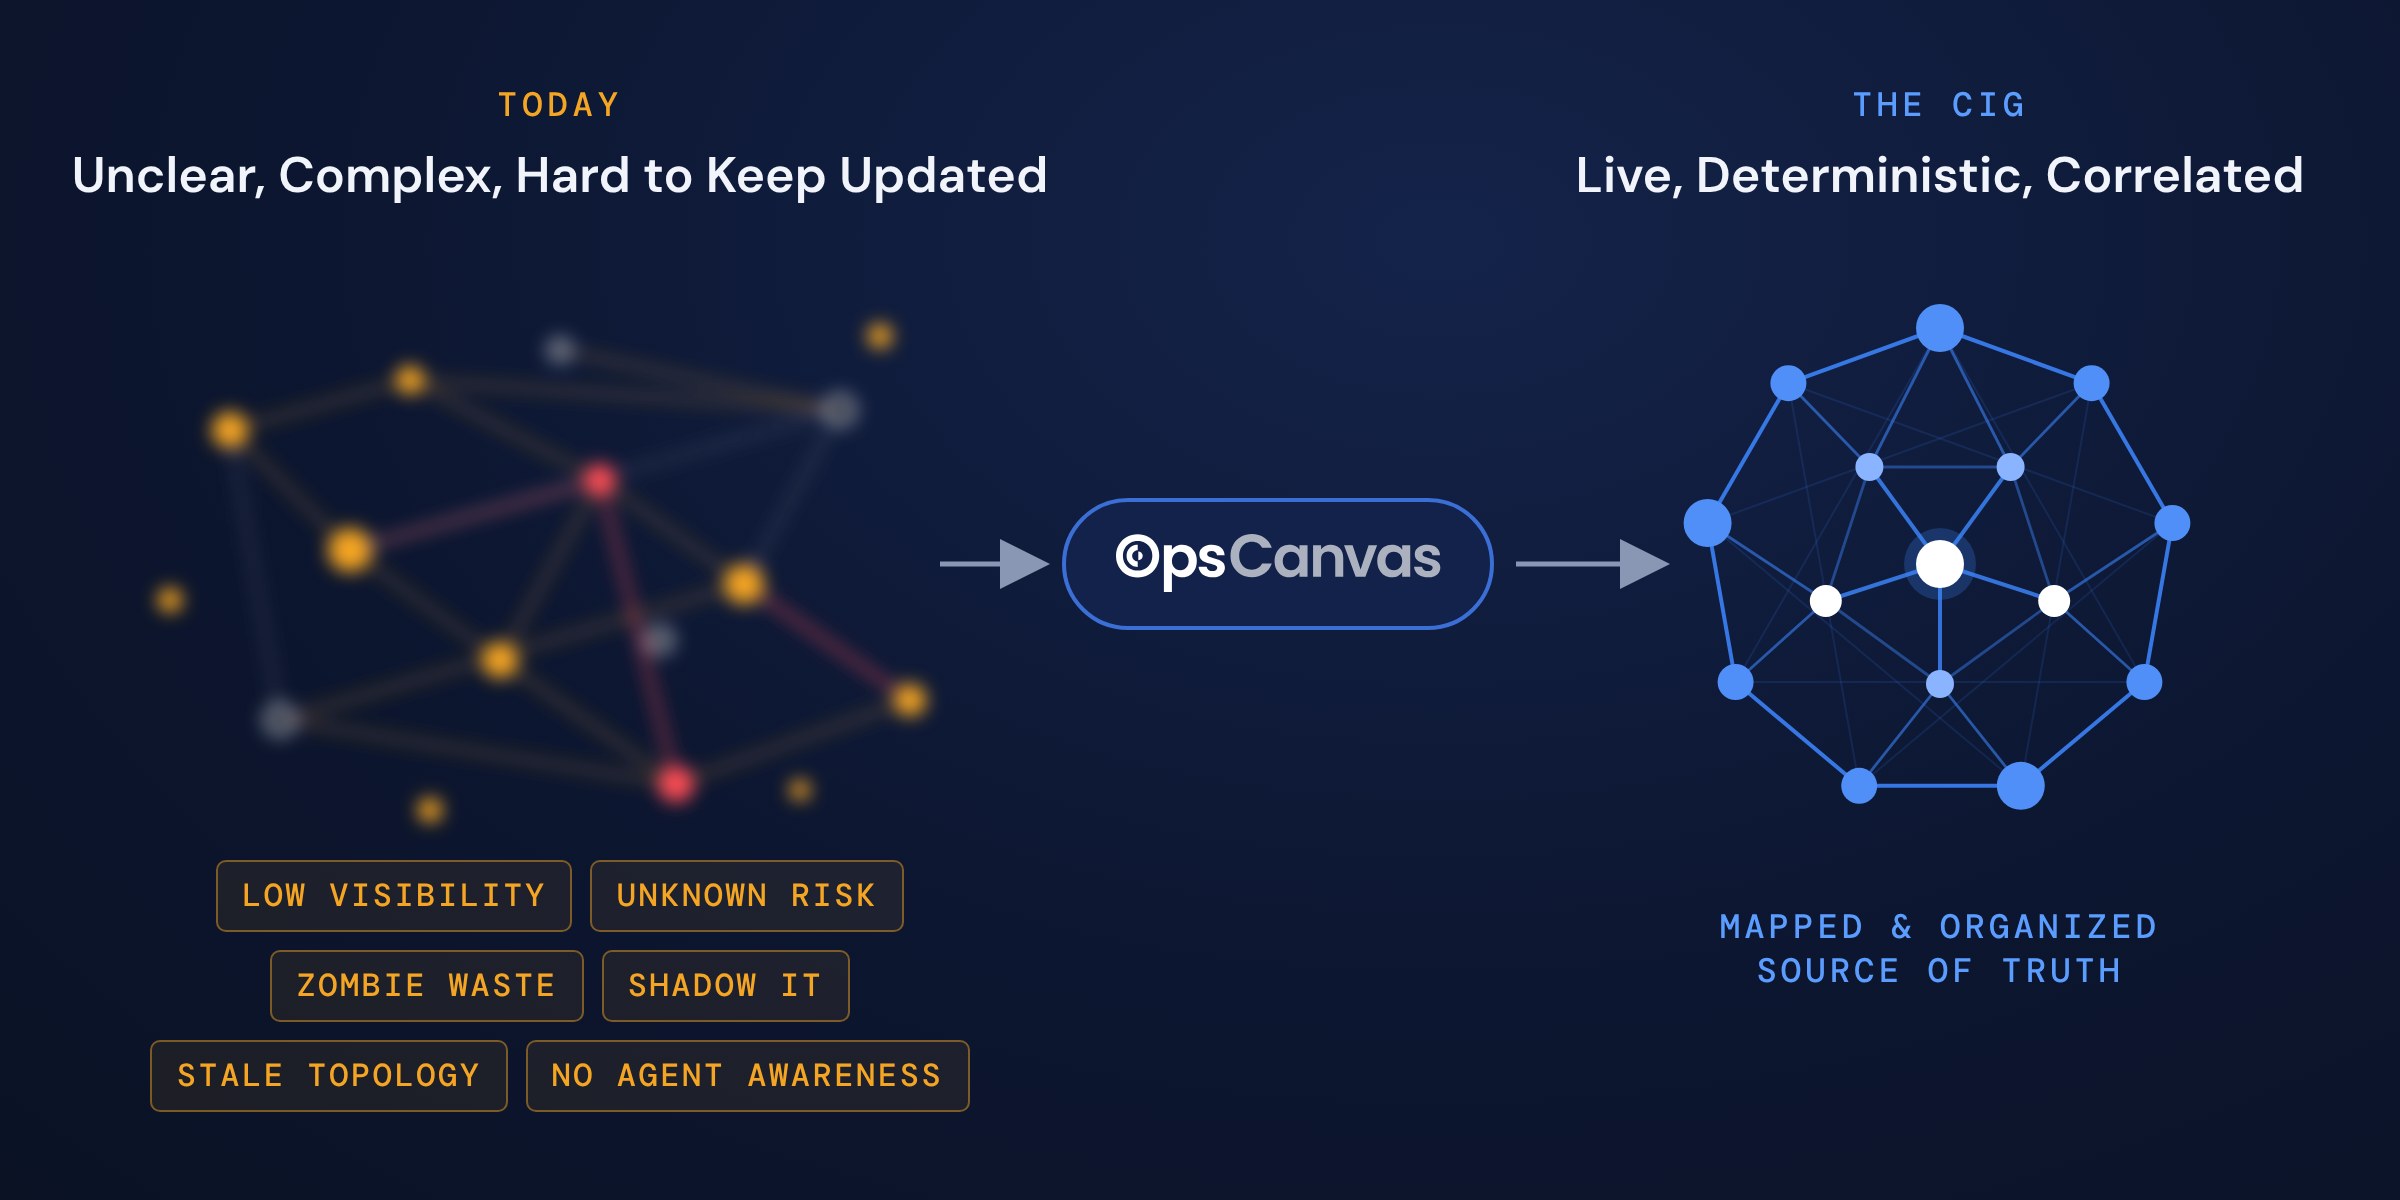
No one has the full picture. And it changes every day.
The complexity and size of the challenges of running cloud software are only growing and speeding up as AI coding agents take over, and unfortunately those same AI models don't understand your cloud.
Built From the Edge
It starts where the trust already lives.
Most attempts to give AI real cloud context start at the center: a data platform, a sync project, a new set of central credentials. They stall, and most get shelved. OpsCanvas starts at the edge, on the engineer's own workstation, and grows from there.
- Runs under each engineer's own access, and credentials never leave the machine
- Each engineer's slice combines into one estate-wide graph on Pro and Enterprise
- No tagging, no collectors, no engineering project. Live context in minutes
- A human approves every change, at every step
Security and privacy How OpsCanvas protects your data
Every answer above comes from the same place: a live map of everything you run, applications and the networks that connect them, built from evidence rather than tags, that your AI queries before it answers. We call that map your Cloud Intelligence Graph™. See how it works →
No New Tools
Live in minutes, inside the AI you already use.
No console to learn, no agent to deploy, no dashboard to check. OpsCanvas works in the AI tool you already have open, with the model you already pay for, on the clouds you already run.
- $ npm install -g @opscanvas/opscanvas
- added 1 package in 6s
- Reading what this workstation already reaches
- AWS · 4 accounts Azure · 2 subscriptions
- Kubernetes · 5 contexts Terraform · 3 states
- Credentials stay on this machine. Nothing uploaded.
- Correlating dependencies and ownership
- 1,180 resources wired by real dependency
- Cloud Intelligence Graph is live
Illustrative session from a sample six-account estate. Larger estates take longer.
Measured
The same model, with the Cloud Intelligence Graph™ and without it.
Thirty-five questions about a real cloud estate, put to the same LLM twice: once with OpsCanvas MCP connected, once with a direct connection to the accounts and nothing else.
Correct with the graph
Every environment question answered correctly, with the evidence trail behind each answer.
Correct without it
Without the graph the model declined to answer rather than fabricate, which is the right call and still leaves you with nothing.
Marginal cost
Bring your own model. OpsCanvas works through the AI subscription your team already pays for, with no separate per-token bill.
Method
Single model, single estate, tool selection by the harness with no prompt engineering. Two further evaluations are being finalized and will publish with their method. Evals and proof →
One Product, Three Ways to Run It
Every rung is the same product with more people and more of the estate on it.
Operator
Your LLM, connected to your cloud. One person, one workstation.
Pro
The same, for your team. Shared context, combined graphs, shared findings and tasks.
Enterprise
The same, hosted by you, running continuously across the estate.
Every edition gets the graph and the know-how. You pay for scope, continuity, coordination, and where it runs.
An engineer joining a team brings their map with them, and moving from Pro to Enterprise is a directory change, not a rebuild.
Coding agents got the spotlight. Cloud engineers, your turn.
Most AI research lumps cloud work in with software development. But running a cloud brings its own stakes: production access, blast radius, cost, and who approves the change. State of AI in Cloud Operations captures your experience using AI on the cloud, and what it would take to trust it with more. Five to seven minutes, no sponsors, and you get the report before it goes public. See how we are running it.
Works With the Tools You Already Run
OpsCanvas works alongside the tools your team already trusts. No rip and replace.
Get Started
Connect the AI you already use to the cloud you actually run.
Free for one engineer, on your own workstation, in minutes. Or talk to us about Pro for your team and Enterprise for the estate.