Capabilities · Cost and Waste
Find the waste.
Then close it safely.
Most waste is already known. It stays because nobody knows what removing it would break. See where cloud and AI spend goes, then fix it knowing who owns it and what depends on it.
What's Included
2 jobs and 3 quick assessments for cost and waste.
Jobs do the work. Quick assessments grade it on a fixed checklist, with the evidence behind every check.
- 01
We get you started.
Every job and quick assessment installs free with Operator. Copy a prompt and run it yourself, or have us or a partner run it with you.
- 02
Better on the graph.
Answers come from live state, owners, reach and cost in your Cloud Intelligence Graph™, not a guess from code.
- 03
Better as a team.
On Pro, everyone works from one shared graph. Findings, plans and context pass between people, and a correction made once counts for everyone.
Jobs 2
- Allocate and explain costSpend by Application, Service and Environment, and why a bill jumped.
- Triage findingsAnother tool's findings mapped to owners, checked live, and grouped by fix.
Quick Assessments 3
- Cost efficiencyWhat to right-size, pause or remove, each saving with its basis.
- CommitmentsWhether reservations and savings plans are used and worth renewing.
- Cost coverageWhether cost data is complete and attributed enough to trust.
The Problem
The waste isn't hidden. It's unowned.
Cost tools already list the savings. Engineers won't touch a resource until they know what depends on it.
- No owner on the recommendation Nobody can say yes, so nothing moves.
- No view of what depends on it Resizing something production needs is worse than the waste.
- AI spend without attribution Model and GPU costs grow faster than anyone can trace them.
What the Graph Finds
Waste you can act on, not just a list.
The graph builds in minutes. Cost analysis follows your first cost report, about 24 hours after setup.
- Spend by app and environmentAvailable Attributed from your billing, without tags.
- Idle, oversized and orphaned resourcesAvailable With the owner and the dependents for each one.
- Compute recommendations, enrichedFindings Pilot Your existing recommendations, with owner, blast radius and cost added.
- Savings verified after the fixFindings Pilot Confirmed against billing, not projected.
Try It Yourself
Copy the prompt. Run it in your AI tool.
Run it in your AI tool with OpsCanvas installed. These are real prompts from the OpsCanvas Help examples.
Sample Jobs
- A bill that jumped Runs: opscanvas-starter-cost
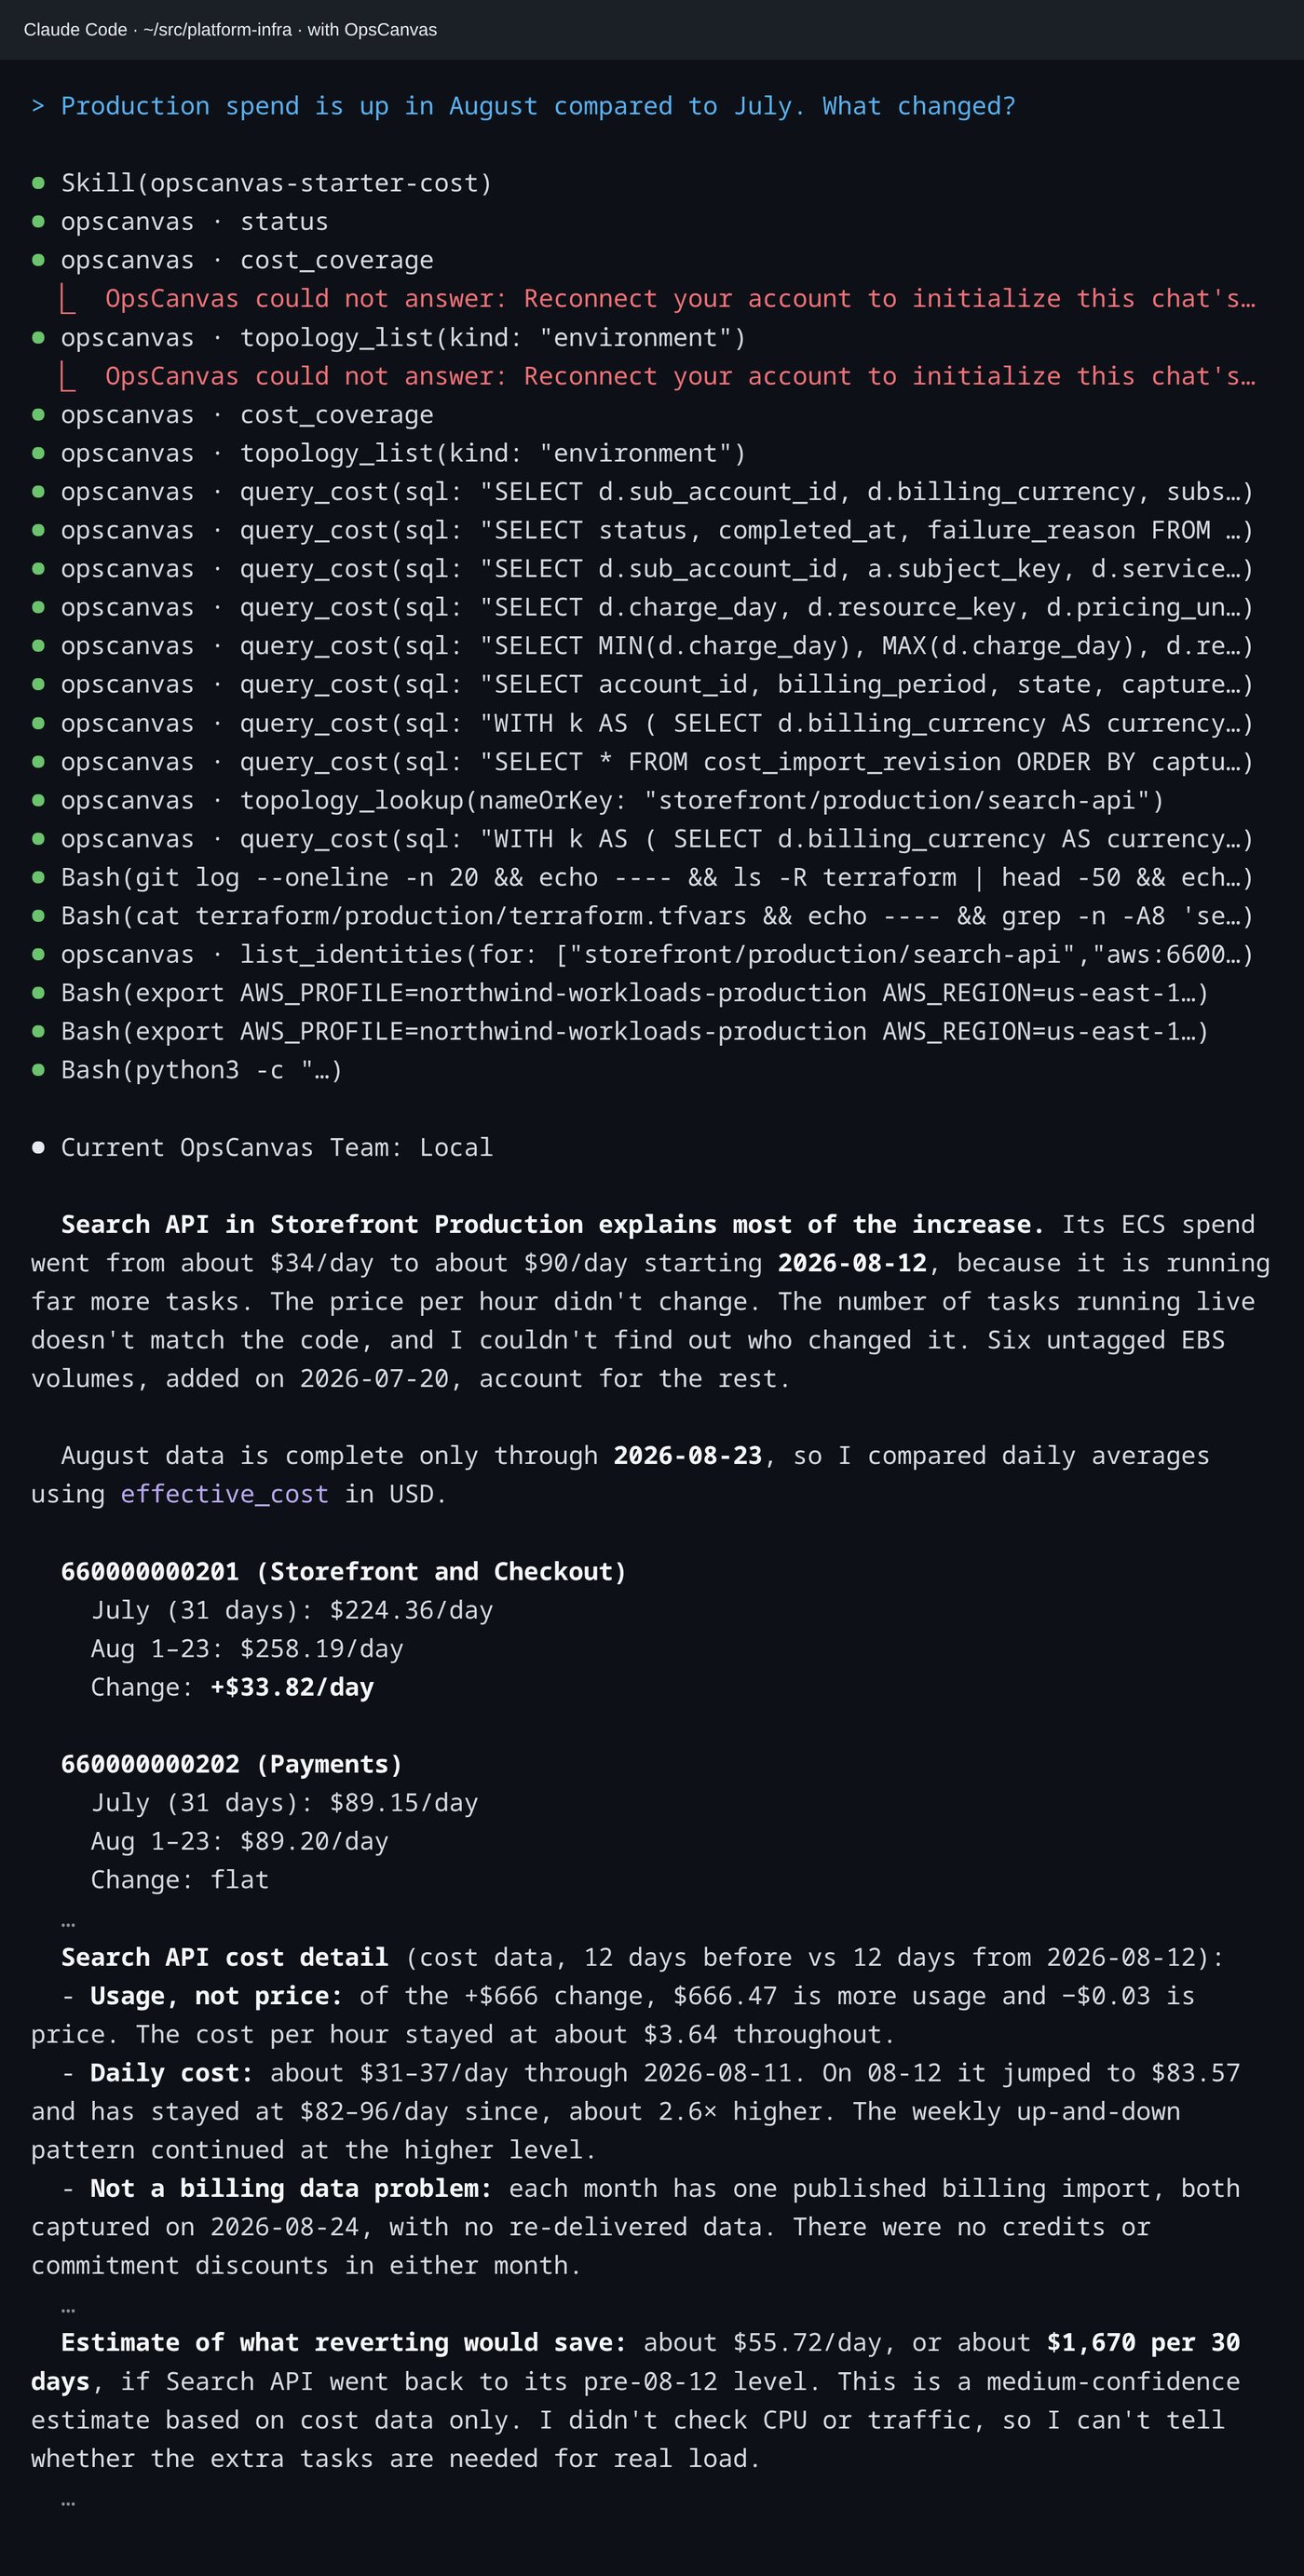
Production spend is up in August compared to July. What changed?- Without the graph
- Queries Cost Explorer itself and finds both causes: search-api scaled from 10 to 26 tasks, and untagged volumes.
- With the graph
- The same two causes, plus usage separated from price, the billing data checked for revisions and credits, and a savings estimate with what it rests on.
In the Session
Not just what changed. What it rests on.
The answer says which data it used, how current it is, and how confident the estimate is.
Better With the Graph
The same question, two different answers.
| Without OpsCanvas | With OpsCanvas | |
|---|---|---|
| The causes | search-api scale-up and untagged volumes, from Cost Explorer | The same two causes, tied to the Application and Environment that own them |
| Usage or price | Not separated | Usage, not price: the cost per hour stayed the same |
| The data itself | Taken as given | Checked for revisions, credits and how current it is |
| What to do next | A monthly cost for the extra tasks | A savings estimate, with its confidence and what it rests on |
On Operator, this work runs against your own slice of the estate. On Pro, the whole team runs it against one shared graph, so what one engineer confirms, everyone can rely on. See Pro →
Want the full loop, from recommendation to verified fix, run with your team? The Findings Remediation Pilot has limited design-partner seats, starting in January. See the pilot →
Cost and Waste
See where your spend goes today.
Free with Operator, in the AI tool you already use.