Cost Visibility and Control · Flagship Assessment
Where are we overspending?
And what should you do about it? OpsCanvas identifies every optimization opportunity, maps dependencies and ownership, and shows exactly what can be changed safely, all within the first 24 hours.
What the assessment delivers
Six domains. One scan. One report.
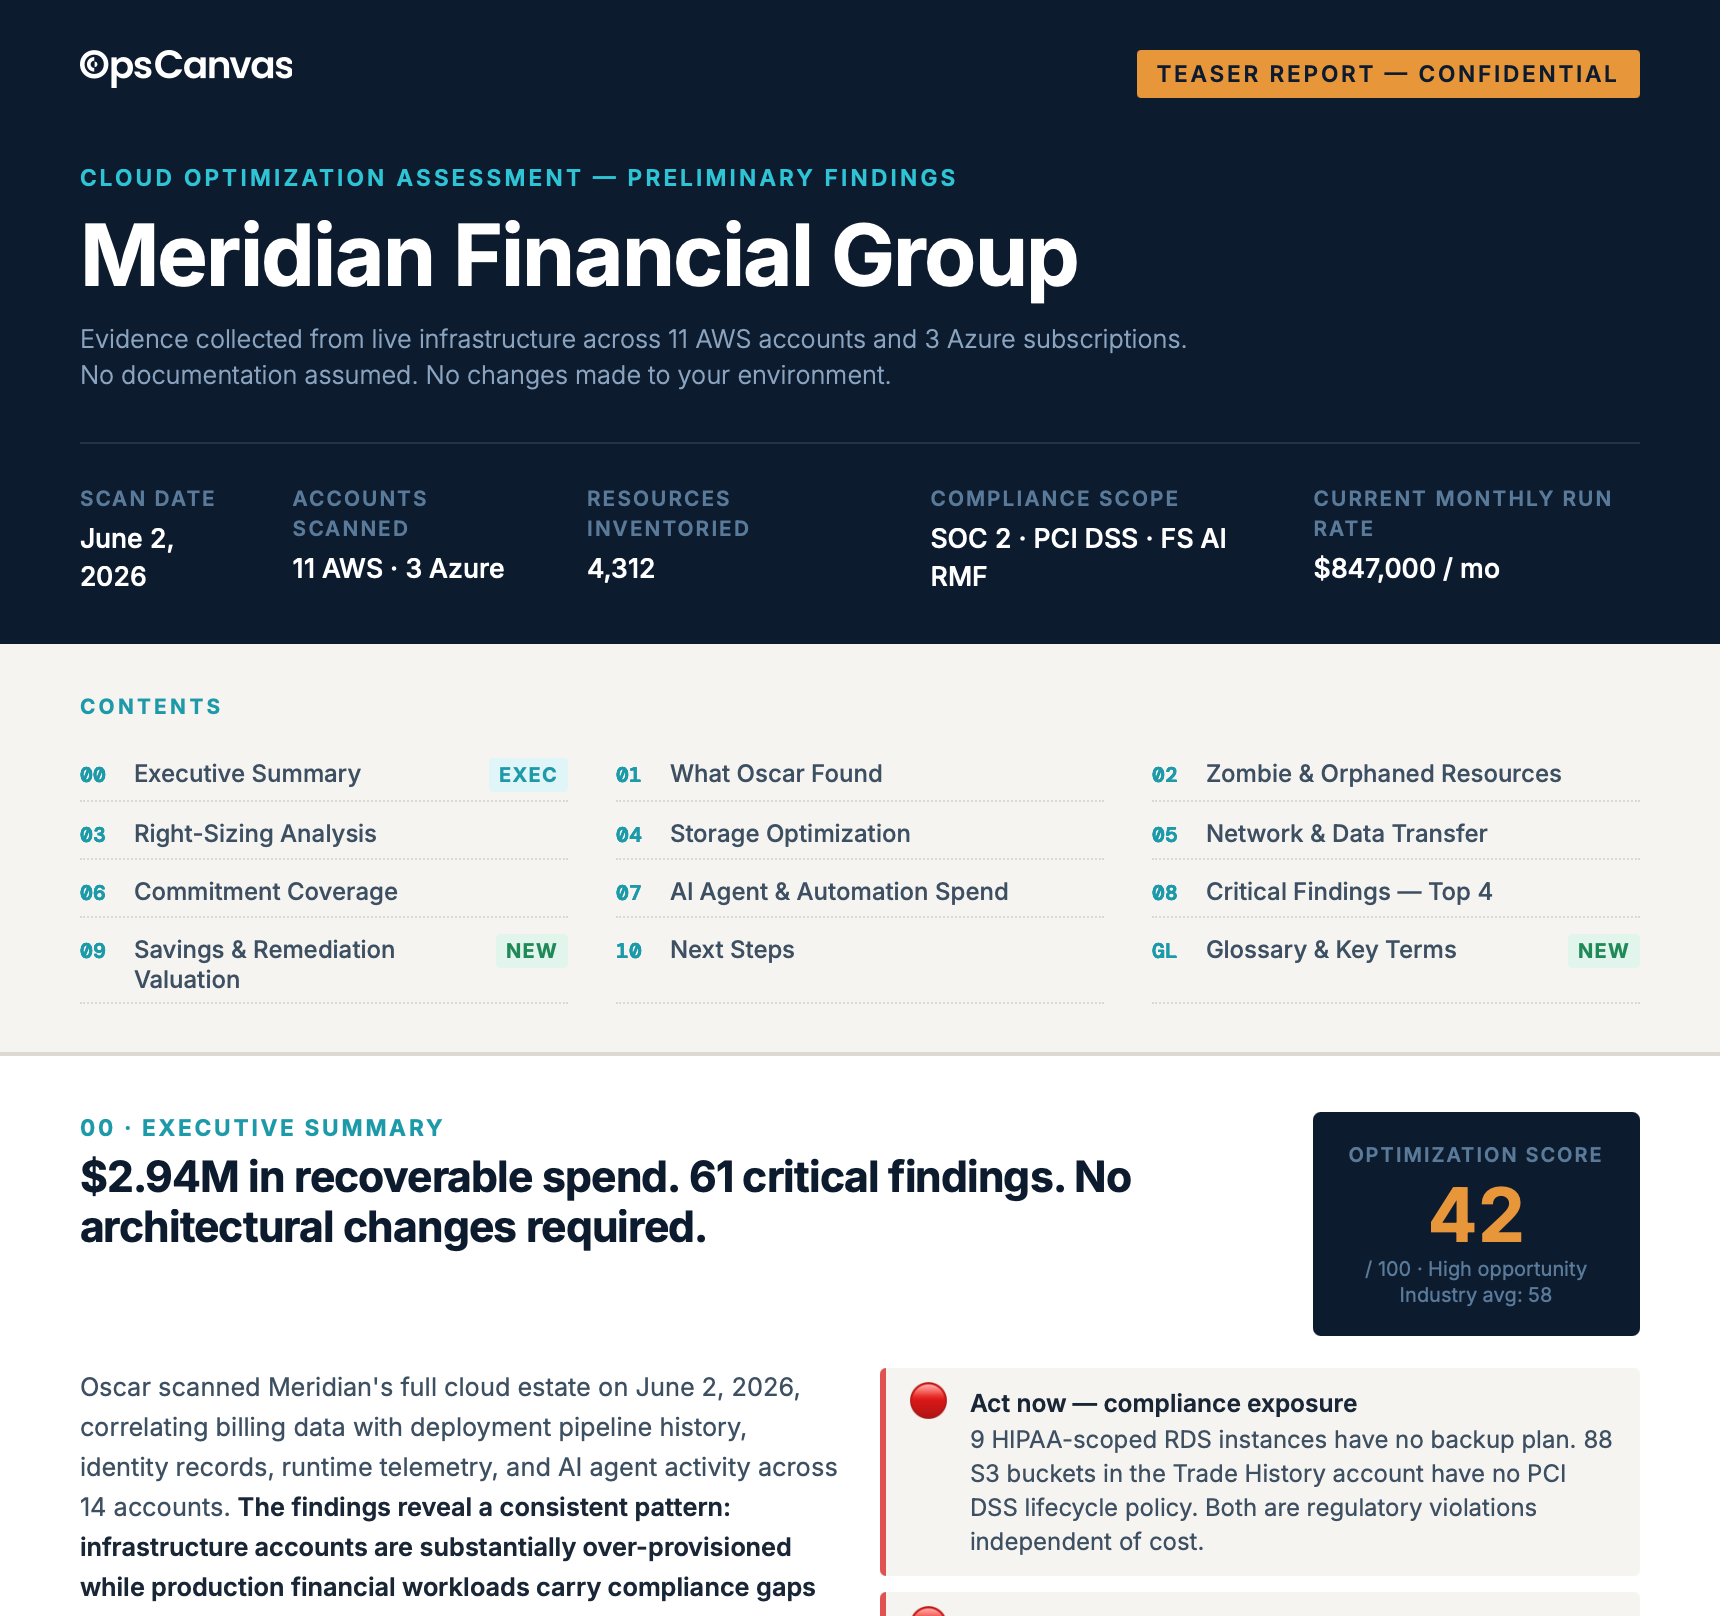
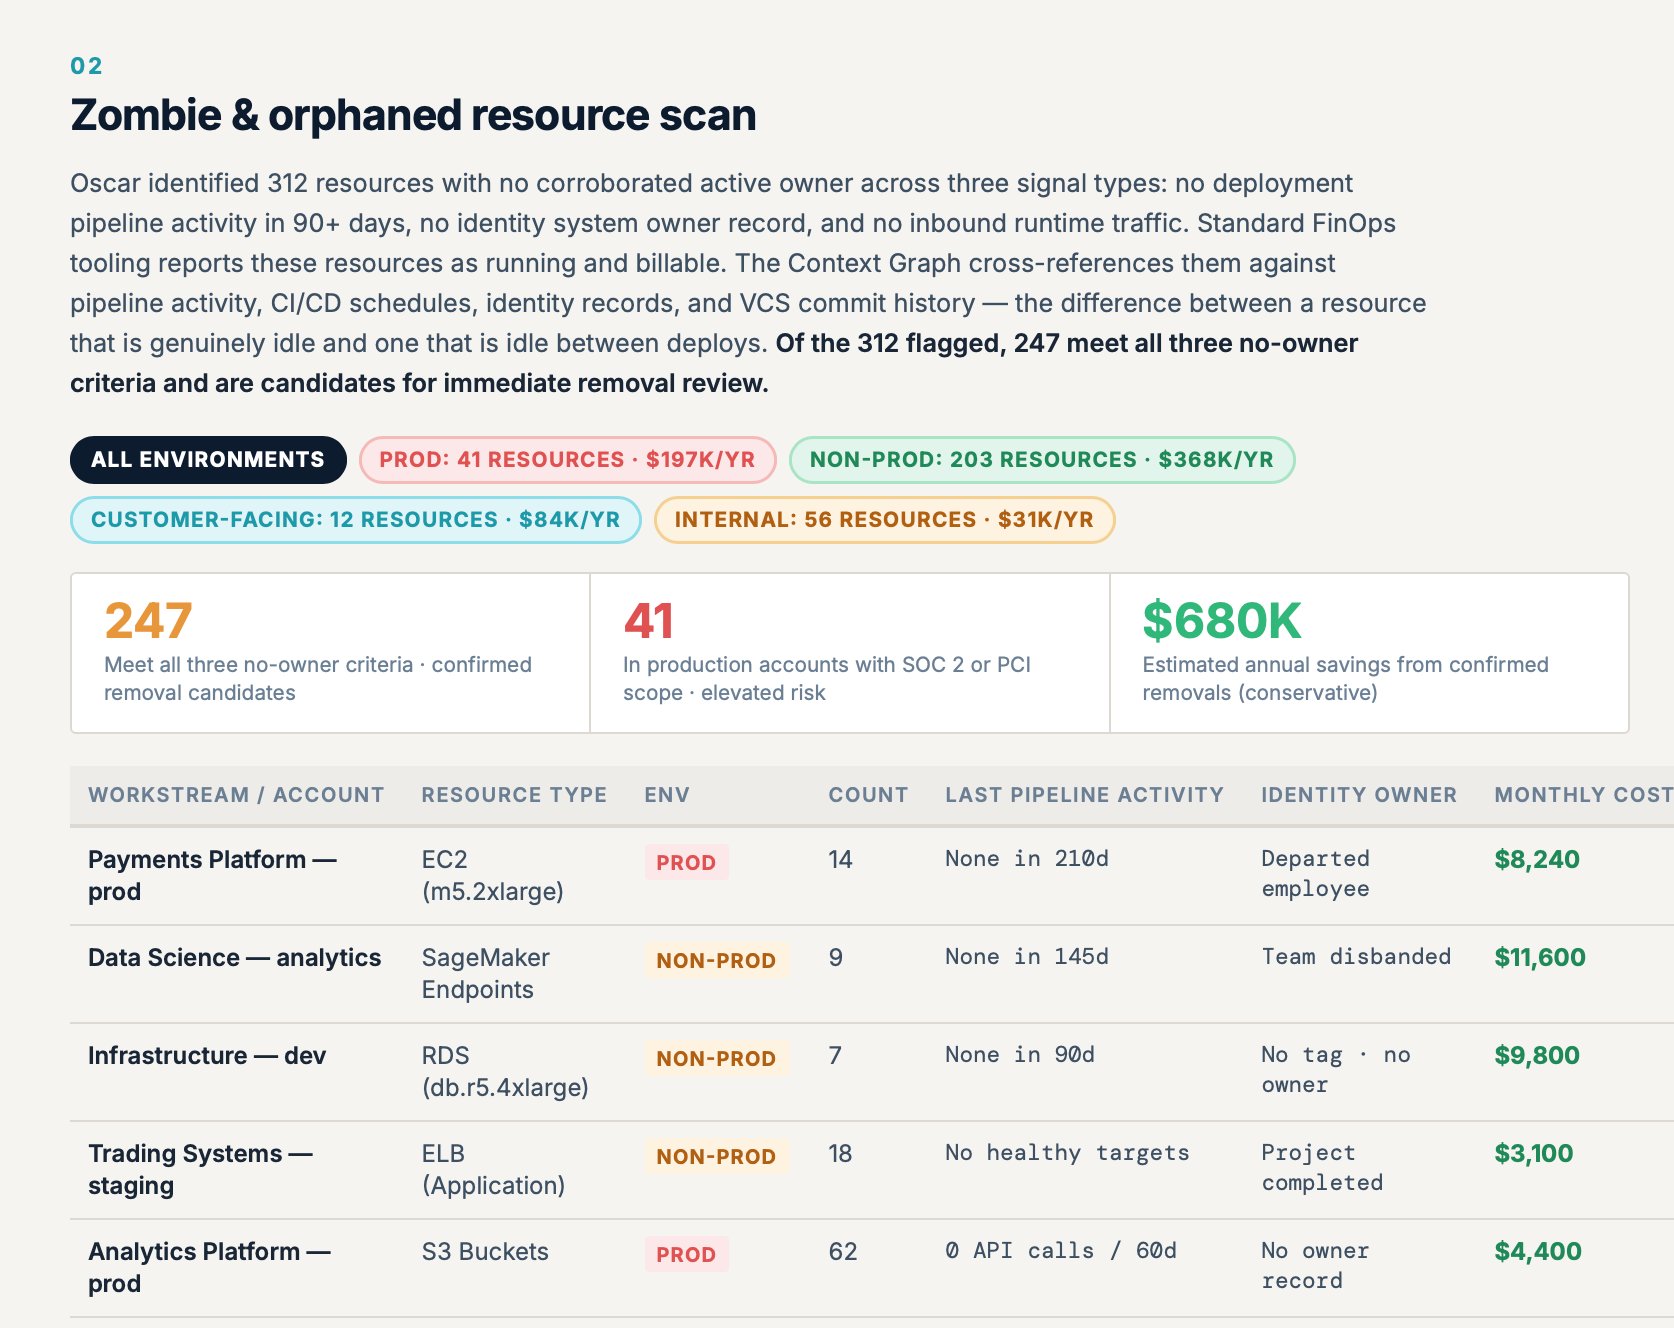
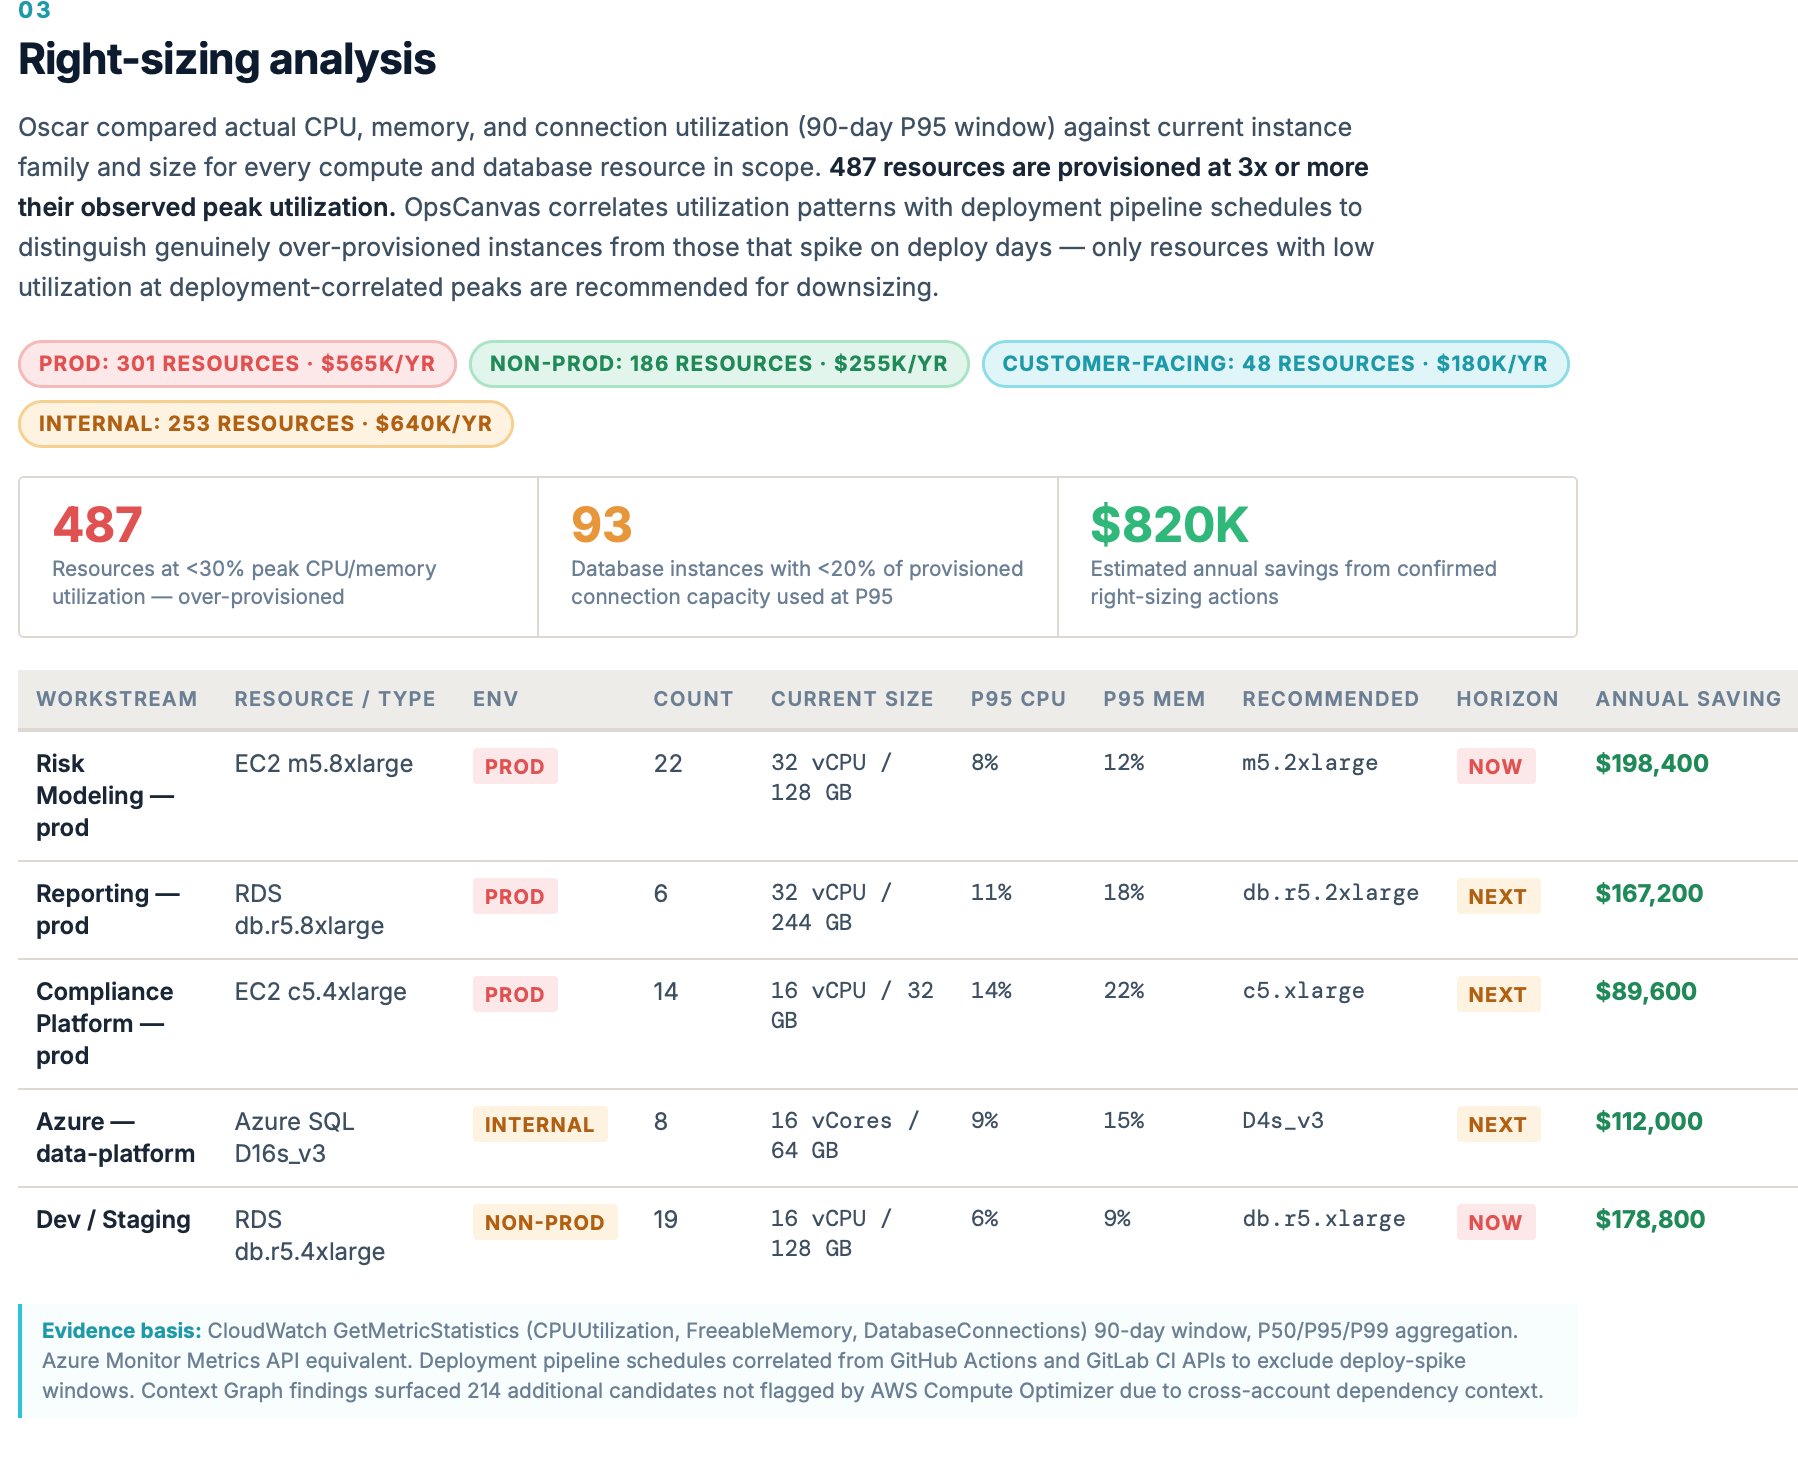
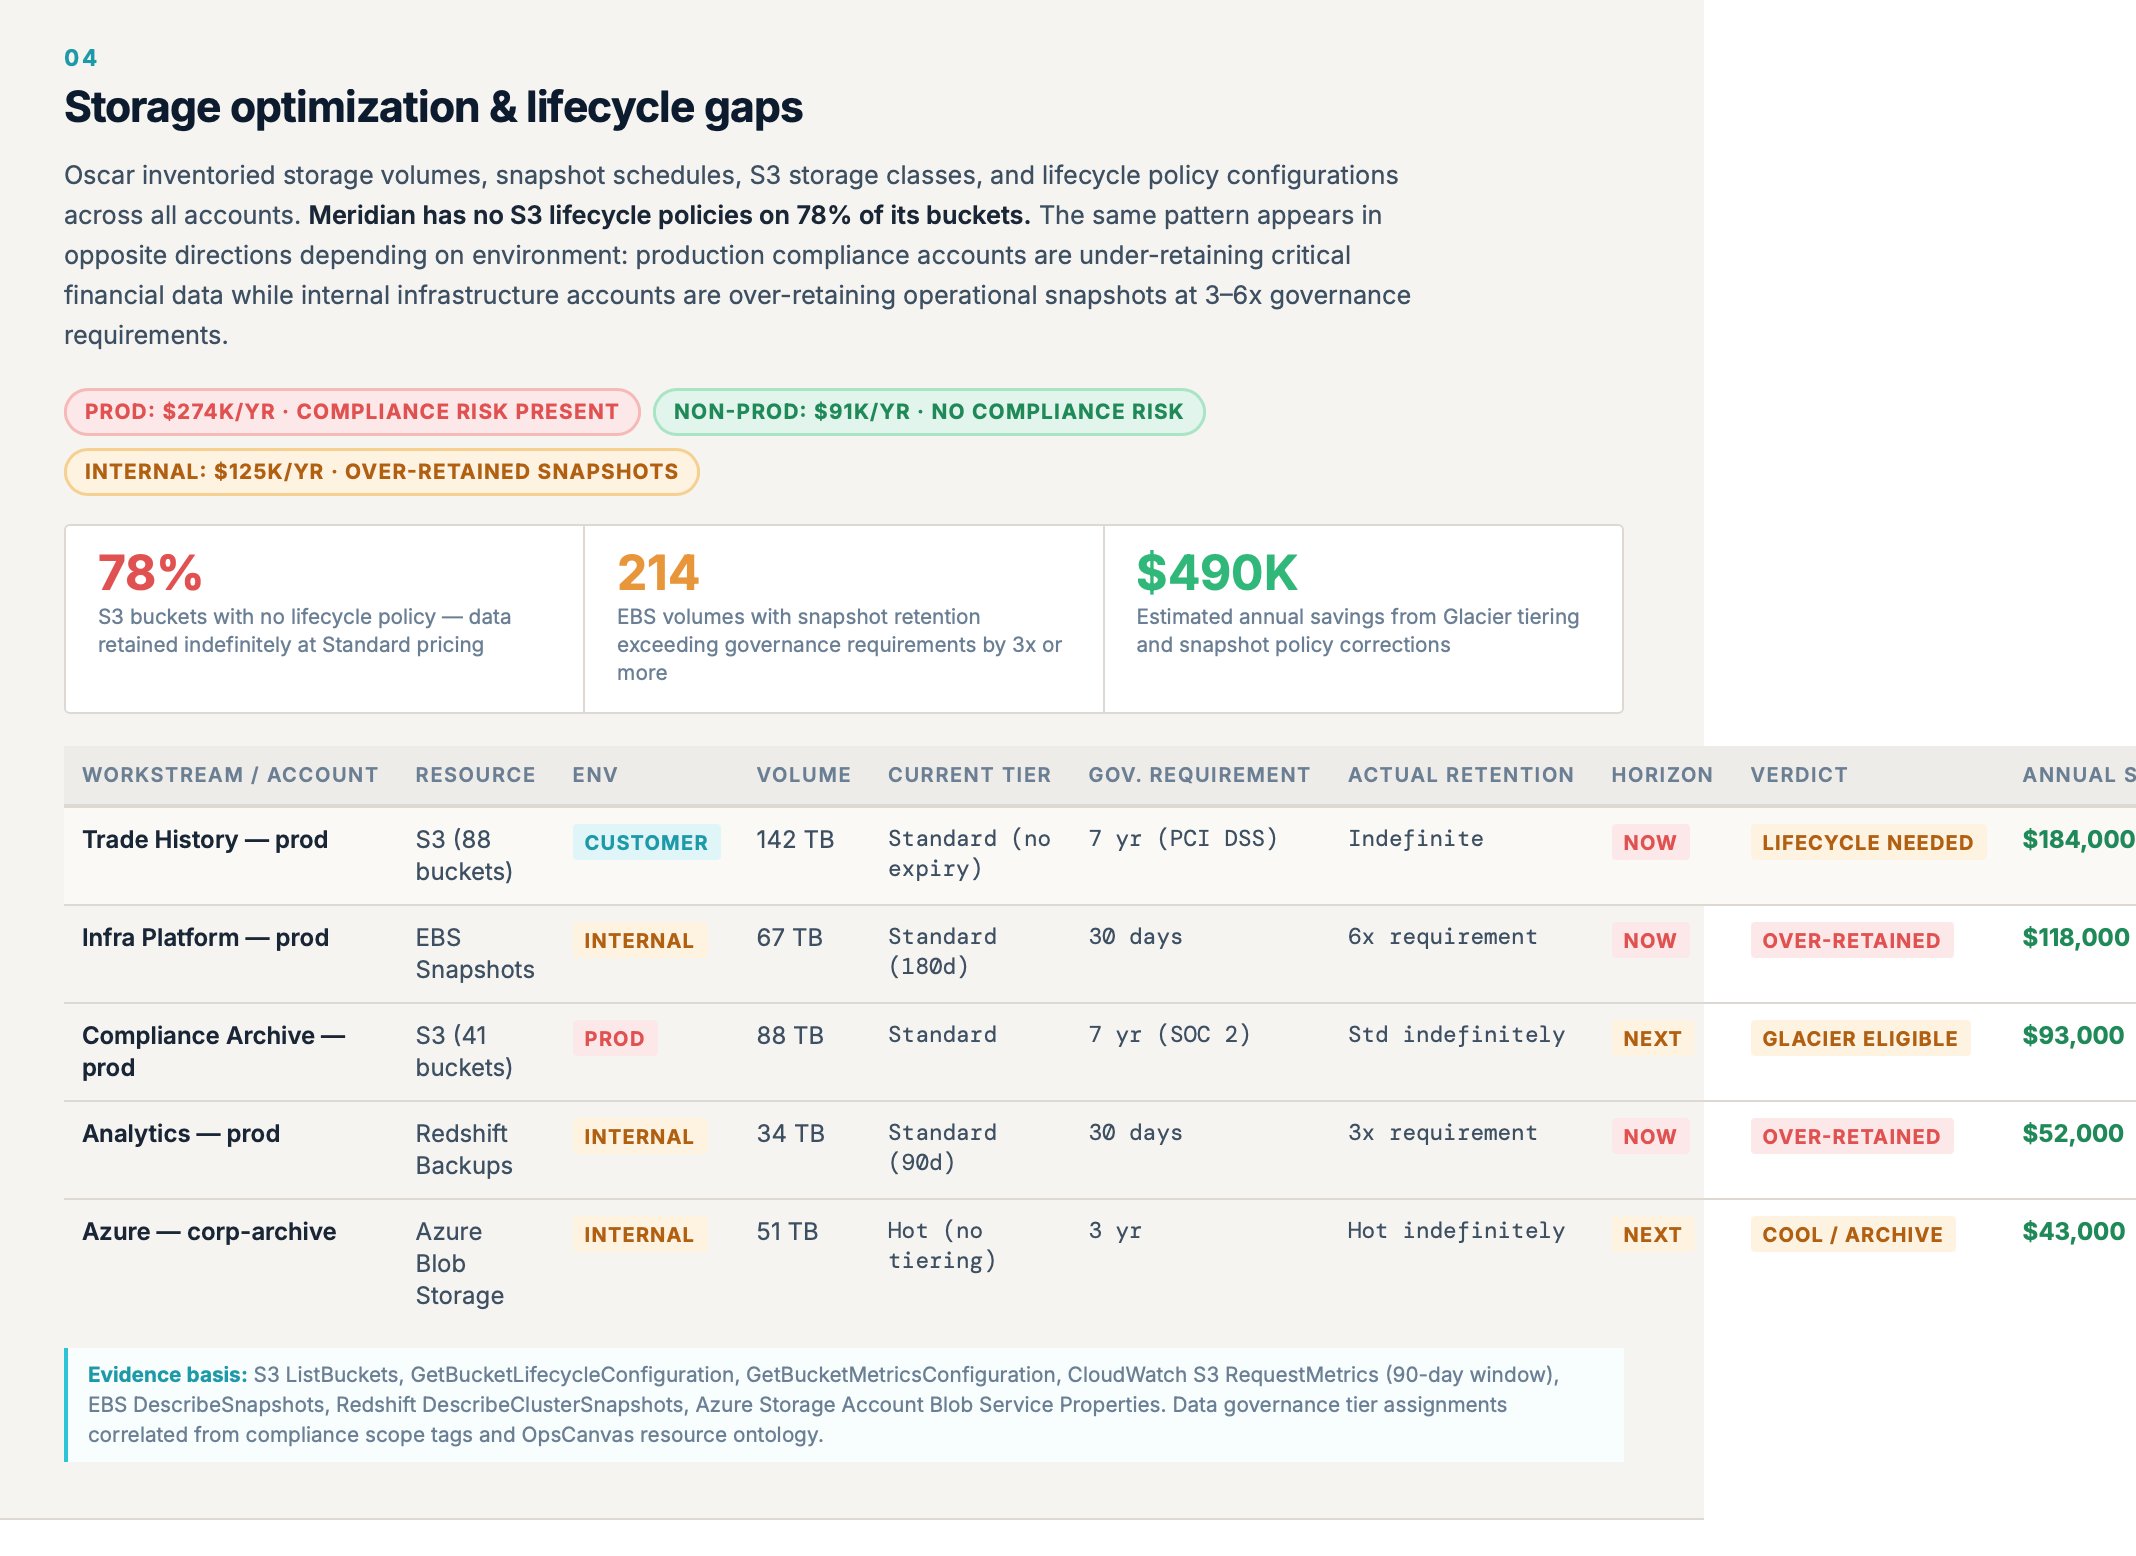
A Cloud Optimization Assessment analyzes your full environment across six dimensions simultaneously. Every finding carries a confidence score, ownership attribution, and a remediation horizon. Here is what the report looks like.
Where This Begins
The flagship assessment, and the start of the waste journey.
This is the default entry point to Cost Visibility and Control. It begins the waste journey: Find Cloud Waste, Investigate Waste Findings, Prioritize Waste Removal. The first run also builds the Cloud Intelligence Graph™ that every other cost offering and journey then uses, and establishes your Benchmark, the baseline your monitoring measures against.
What it hands you is a chain, not a document: findings become recommendations, recommendations become proposed tasks, and the Benchmark makes progress measurable from that day forward.
- Already have findings from another tool? Start with OpsCanvas Pro for Cloudability instead: your existing findings validated for safety and ranked by real ROI.
Six Optimization Domains
What standard FinOps tooling misses in every domain
A FinOps tool sees your bill. The Context Graph sees your environment. In every domain, that difference changes what is actionable.
A list teams don't trust. Can't tell a quarterly batch job from dead weight.
Three-signal scoring. 247 of 312 confirmed high confidence.
Utilization numbers with no dependency context. Teams don't act.
Dependency map verifies safety first. Surfaces 214 candidates Compute Optimizer missed.
GB and tier costs. No governance or compliance context.
Compliance scope cross-referenced against actual lifecycle config. Cost and regulatory gaps in one finding.
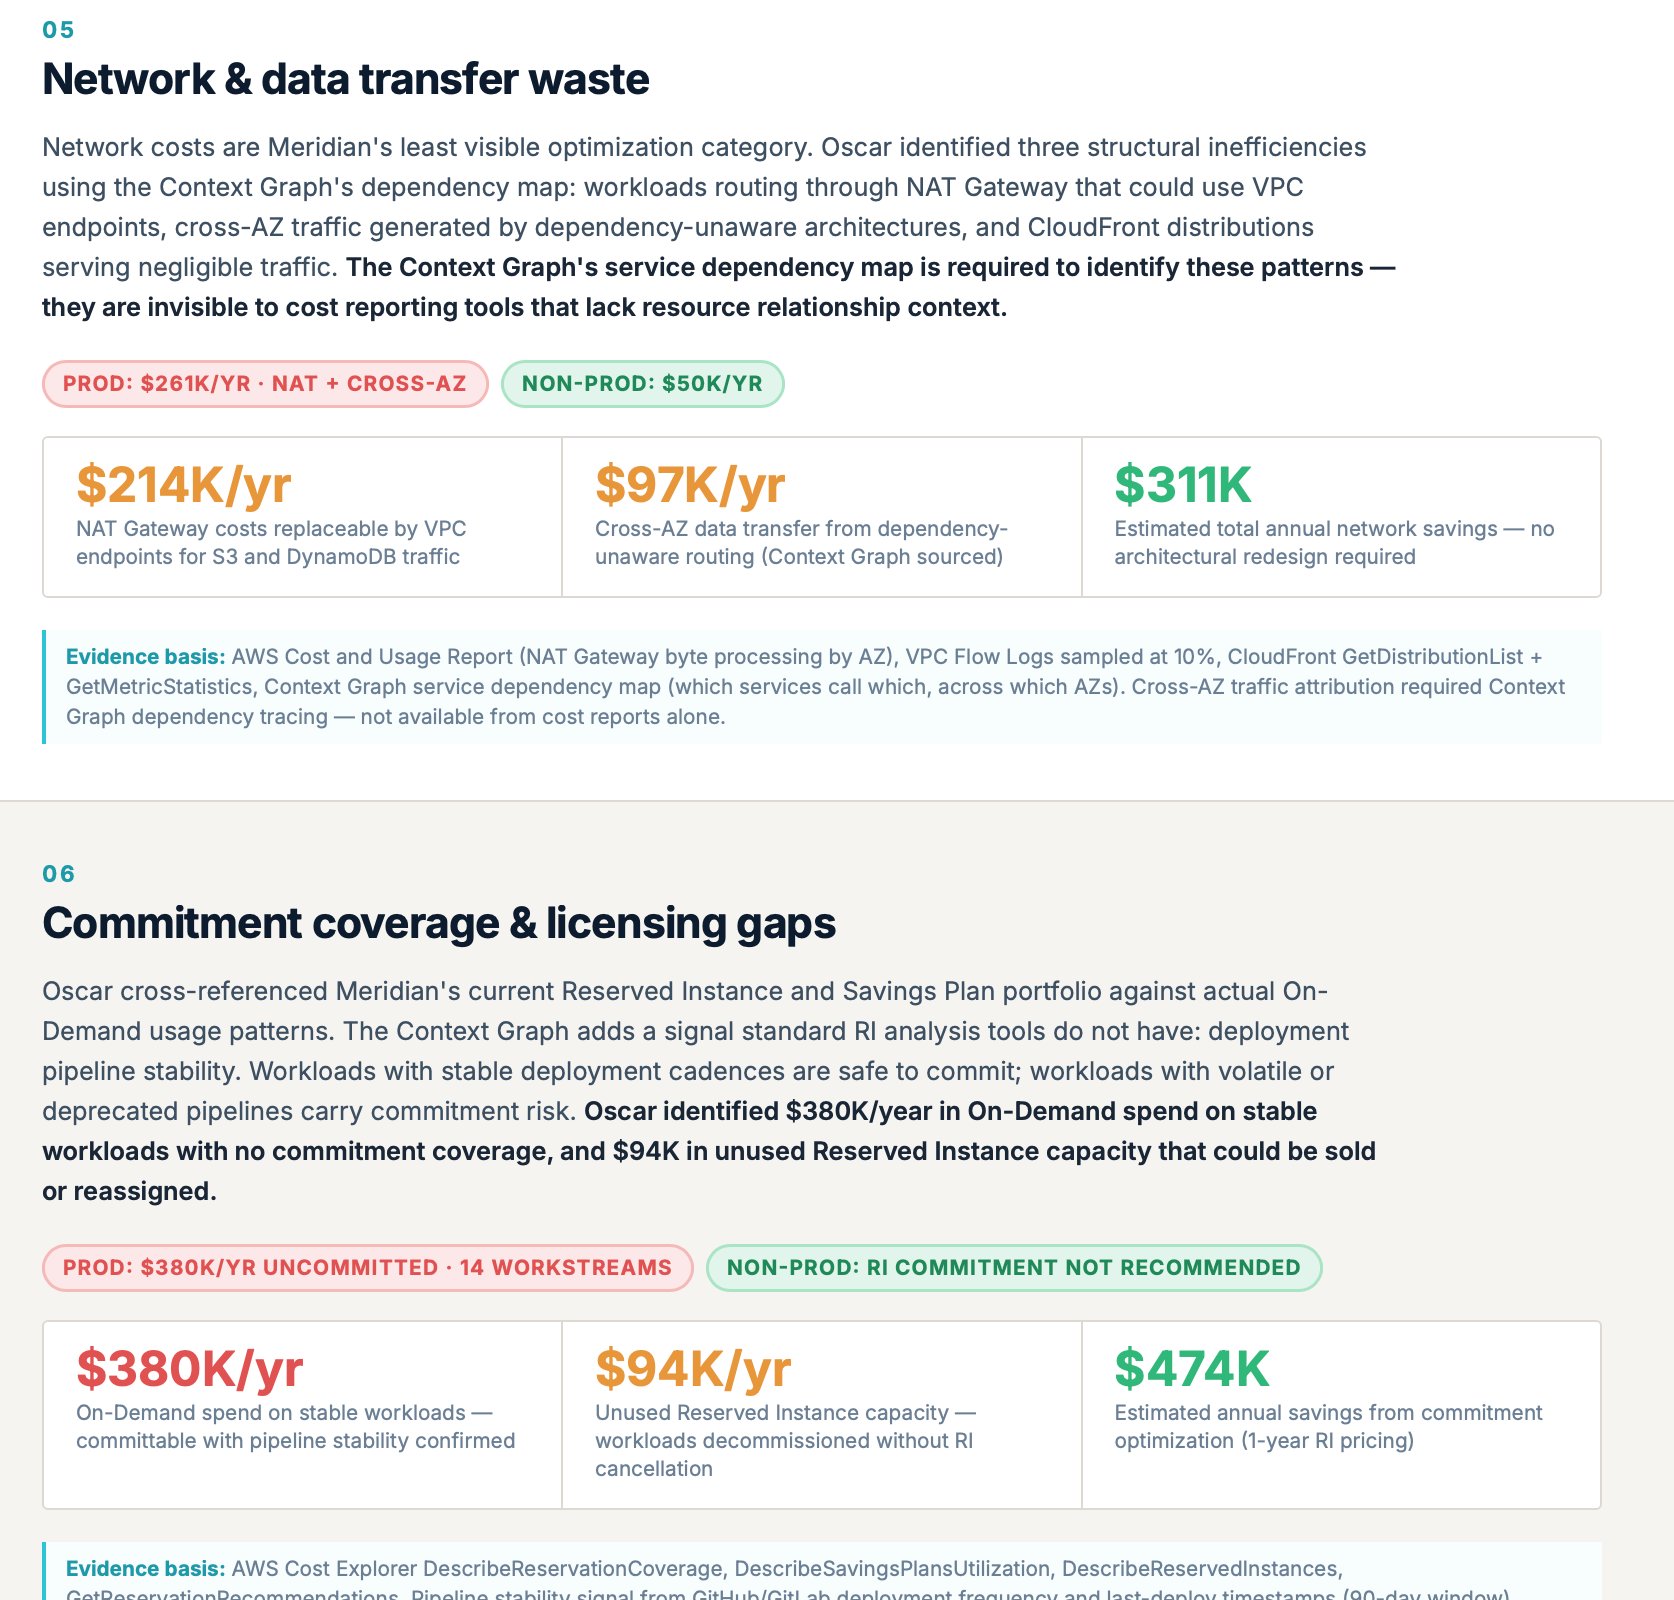
NAT charges appear in the bill. Source is invisible without dependency data.
Service dependency map traces which calls generate cross-AZ traffic and unnecessary NAT routing.
RI tools can't tell stable workloads from volatile ones. Risky commitments.
Pipeline stability verified per workstream before any commitment recommendation.
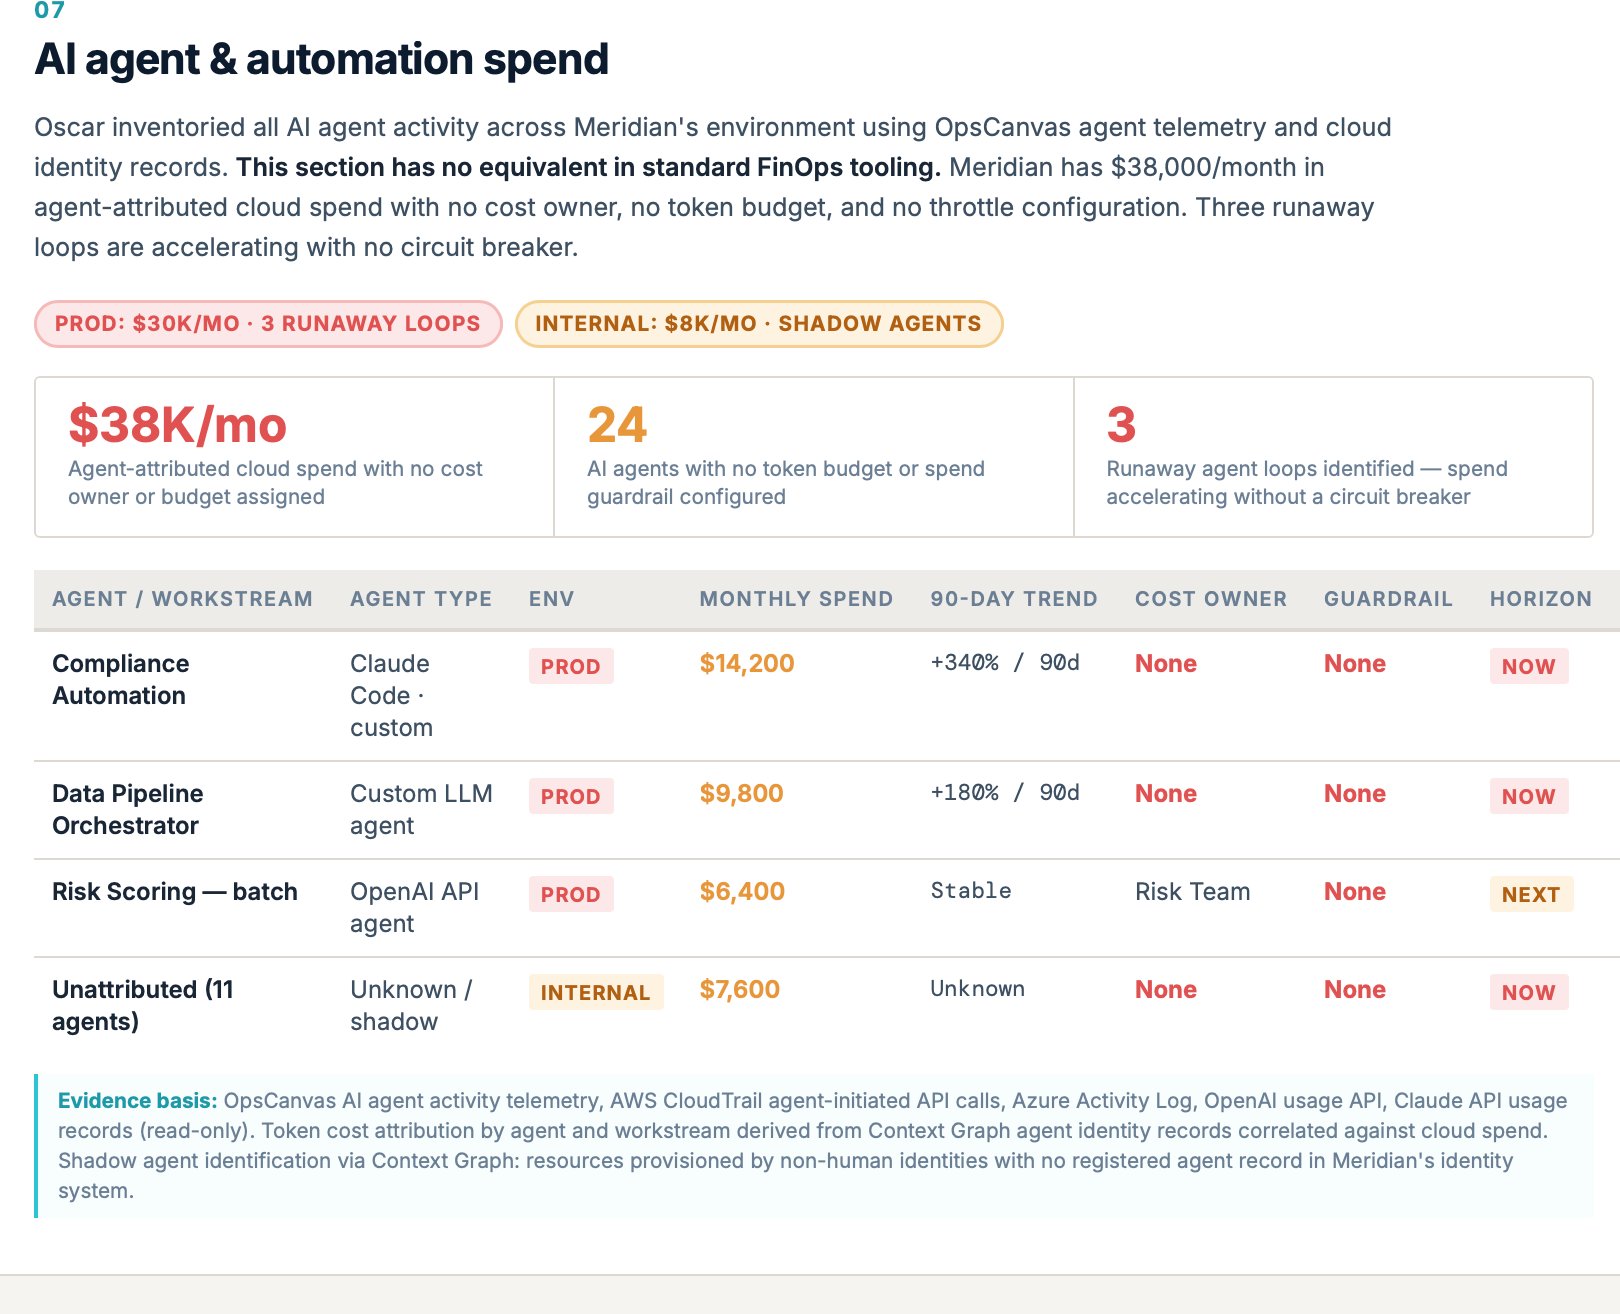
No FinOps tool covers agent identity. Token costs and runaway loops are invisible.
Per-agent cost attribution, runaway loop detection, and shadow agent identification.
The Real Blocker
Optimization stalls because teams can't act confidently. The Context Graph fixes that.
Every finding comes with the evidence needed to move. Who owns this? What depends on it? What breaks if it changes? Answered before you act.
Ownership attributed, not guessed
Every finding traces to a team or individual via pipelines, CI/CD history, and identity records, not tags alone.
Blast radius before you act
The dependency map shows what will be affected by every proposed change before anything touches production.
Confidence scores on every finding
High-confidence removals are separated from items needing ownership verification. Work the right things first.
Idle vs. purposefully quiet
DR standbys and quarterly batch jobs look idle. The Context Graph carries months of history to tell the difference.
Governance memory built in
Team preferences like 'maintain 10% headroom' are captured once in the Context Graph and applied consistently to every recommendation.
Shared context across your team
OpsCanvas Pro lets your whole team work remediations together. One engineer's investigation benefits everyone. No repeated discovery.
How It Works
Less than one hour of your team's time. Results in 24 hours.
No multi-week onboarding. No consultants to brief. No data export to prepare. OpsCanvas connects with read-only credentials and does the work.
Connect your environment
Read-only credentials, your existing role assumptions. No changes made. No credentials stored centrally. Works across AWS, Azure, and GCP simultaneously. Your team's involvement at this stage: under one hour.
Under 1 hour of engineering timeOpsCanvas builds the Context Graph
OpsCanvas correlates cloud account data against deployment pipelines, CI/CD history, identity records, VCS commit history, runtime telemetry, and AI agent logs. Six domains analyzed simultaneously. No team time required.
Fully automatedReport delivered in 24 hours
Resource-level findings with confidence scores, ownership attribution, environment classification, and remediation horizons for every item. Not a list of opportunities. An evidence-backed plan your team can act on immediately.
Full findings in 24 hoursWhy OpsCanvas
How we compare to the alternatives.
Every FinOps team considers the same options. Here is where each falls short.
What You Receive
Not a list. An evidence-backed plan.
Every item in the assessment report is backed by traceable evidence. Here is what every engagement delivers.
Where It Leads
Two ways to keep going on the same graph.
The assessment answers the question and builds the graph. What comes next depends on what you need: depth on prioritization, or the hold that keeps the achieved state achieved. If your organization runs a FinOps practice, the sequence maps directly onto the FinOps Foundation lifecycle: the assessment informs, monitoring and remediation optimize and operate.
OpsCanvas Pro for Cloudability
When the findings pile up, ours or another tool's, OpsCanvas Pro validates them for safety against dependencies and change history, ranks them by real ROI, and tracks every fix to verified savings.
Delivers
- Safety verdicts with evidence: safe, unsafe, or needs review
- ROI-ranked remediation plan
- Owned, tracked tasks, verified after the fix
Cloud Cost Monitoring
Recurring reassessment and continuous detection against your Benchmark. New waste, spend anomalies, and attribution drift surface as they appear, and drift becomes new tasks instead of a new project.
Delivers
- Movement measured against the Benchmark this assessment established
- New waste and spend anomalies surfaced as they appear
- Quarterly, monthly, or continuous cadence
Part of the Cost Visibility and Control solution.
The Cloud Cost Optimization Assessment is the flagship entry point to a continuous cost practice: correlated visibility from the Cloud Intelligence Graph™, journeys from finding waste through forecasting with confidence, and tasks that carry the work to verified done.
Get Started
Find out what you are spending on that you do not need to be.
Less than one hour of your team's time to connect. Full findings across all six optimization domains in 24 hours. Evidence your team can act on, not a list to argue about.