Hundreds of recommendations, zero context
Findings are generated from billing data alone. Without topology, dependencies, and ownership, each one is a guess about safety and a guess about effort.
Cost Visibility and Control · Assessment
Turn cost optimization findings into a safe, ROI-ranked remediation plan.
You already have the findings. A FinOps platform, a cloud provider cost tool, or a consultant delivered hundreds of recommendations. We tell you which ones are worth doing, which ones are safe, and in what order.
The Problem
Producing cost findings is a solved problem. Turning them into action is not. In most organizations, the gap between the two is weeks of engineering triage, done by hand, ticket by ticket.
Findings are generated from billing data alone. Without topology, dependencies, and ownership, each one is a guess about safety and a guess about effort.
The people who have to execute the recommendations are the ones who know how much the list doesn't know. So the list waits, and the savings stay theoretical.
Validating each finding means tracing owners, checking dependencies, and reconstructing change history by hand. That work lands on senior engineers, and it is exactly where cost initiatives stall.
The 'idle' database a monthly batch job depends on. The 'orphaned' volume a DR plan needs. Every unsafe finding that burns an engineer takes trust in the whole list down with it.
Findings need context before they become action. A recommendation generated from billing data alone is a guess. The same recommendation, landed on a live graph of topology, dependencies, ownership, and change history, is a decision.
How It Works
The assessment takes the findings you already have, ours or any other tool's, and puts the Cloud Intelligence Graph™ underneath them. The tool that produced your findings stays exactly where it is. We add the layer it doesn't have.
Your findings are brought into the Cloud Intelligence Graph™, where each one lands on the actual resource it refers to, with its dependencies, owners, and change history attached. For the first time, every finding has its full context in one place.
Graph context eliminates unsafe recommendations before anyone acts on them: the idle-looking database a batch job hits monthly, the orphaned volume a DR plan depends on, the oversized instance that absorbs a known traffic spike. What survives the filter is safe to execute.
Savings weighed against effort, factoring in dependencies, blast radius, and owner availability. The output is an ordered, evidence-carrying remediation plan, not a theoretical savings number.
Under the Hood
What You Get
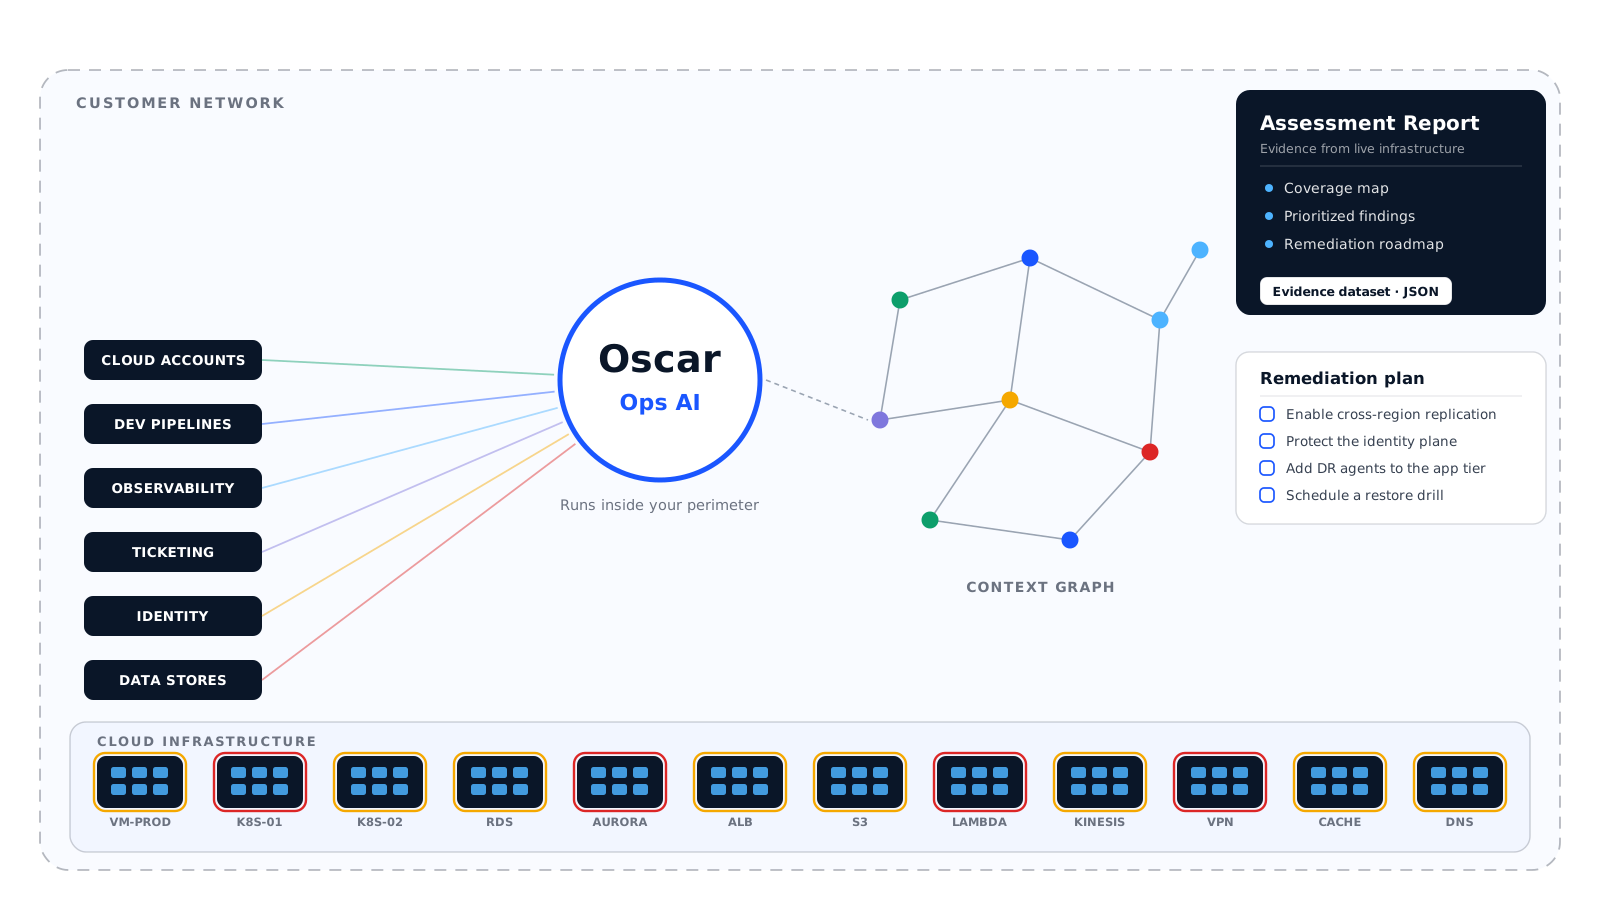
Every deliverable is grounded in what Oscar observed in your live environment, and every call comes with the evidence behind it.
Every finding you brought, dispositioned: kept, killed, or needs-review, with the graph evidence behind each call. The killed ones matter as much as the kept ones; they are the ones that would have burned your team.
The surviving findings ordered by real return: savings vs effort vs blast radius. The highest-value, lowest-risk work rises to the top, so momentum builds instead of stalling.
Each planned remediation arrives as a proposed task: dependency-aware, evidence-carrying, and ready to assign to the right owner on your team, a partner team, or Oscar.
For teams that want help with the follow-through, Oscar can work the plan with you, task by task, with completion verified against the live environment.
Oscar works with approval gates: nothing in your environment changes without you. The assessment itself is read-only; remediation, when you choose it, runs task by task with an explicit human decision at every gate.
Where This Fits
The Cost Visibility and Control waste journey runs Find, Investigate, Prioritize. This assessment is the middle two, packaged as one engagement: it investigates the findings you already have and prioritizes what deserves action. If the findings came from our own Cloud Cost Optimization Assessment, this is the natural next step. If they came from another tool, this is where they become actionable.
Don't have findings yet? Start with the Cloud Cost Optimization Assessment: it finds the waste, builds the graph, and establishes your Benchmark. Afterward, monitoring keeps the plan honest as your environment changes.
How It Compares
The alternative to this assessment is not another tool. It is your engineers validating findings by hand.
Frequently Asked Questions
The Findings ROI Assessment takes cost optimization findings you already have, from a FinOps platform, a cloud provider cost tool, a consultant, or an OpsCanvas assessment, and turns them into a safe, ROI-ranked remediation plan. Findings are correlated into the Cloud Intelligence Graph, filtered for safety using dependencies and change history, and ranked by savings versus effort versus blast radius.
No. Your FinOps platform is good at producing findings, and it stays exactly where it is. OpsCanvas is the context and verification layer over those findings: it adds the topology, dependency, ownership, and change context that billing data alone cannot provide, so the findings your tools produce actually get acted on.
Cost optimization findings from any source: FinOps platforms, cloud provider cost and optimization tools, consultant reports, or OpsCanvas's own Cloud Cost Optimization Assessment. We scope the specific inputs and formats with you during the engagement.
Each finding is landed on the actual resource it refers to in the Cloud Intelligence Graph, which carries that resource's dependencies, ownership, and change history from the live environment. A recommendation is only kept if the graph shows it can be executed without breaking something that depends on it. Findings that fail that check are killed or marked needs-review, with the evidence attached.
No. The assessment runs read-only: Oscar connects with existing credentials, builds the graph, and correlates your findings against it. If you later choose Oscar-assisted remediation, every change runs through approval gates: nothing in your environment changes without an explicit human decision.
The remediation plan arrives as proposed tasks, ready to distribute to your team, a partner team, or Oscar inside approval gates. Many teams then add monitoring, so new findings are validated against the same graph as they appear instead of piling up for the next triage round.
The Findings ROI Assessment is one of three ways into a continuous cost practice: correlated visibility from the Cloud Intelligence Graph™, assessments that answer specific cost questions, and tasks that carry the work through to verified done.
Get Started
Send the export from whatever produced your cost findings. We put the context underneath: what is safe, what is worth it, and in what order. You get a plan your engineers will actually execute.
Vendor-neutral · Works alongside your FinOps platform · AWS, Azure & GCP